Azure Auth Series — Blog 8: Production Readiness#
In Blog 7, we put an API gateway in front of three microservices. APIM validates JWTs, forwards claims as headers, and rate-limits users. The system works — but if a service starts failing at 3 AM, nobody knows until users complain. There are no metrics, no alerts, no health checks, and the Notification and Audit services are publicly reachable by anyone who guesses the URL.
This blog adds observability and security hardening. One new Terraform module creates Application Insights, Log Analytics, and alert rules. Three lines of Python give every service automatic distributed tracing. And two Terraform changes lock down internal services and add health probes.
Source code: github.com/MinhQuanBuiSco/Azure/.../08_production
The Azure Auth Series#
| Blog | Topic | What You'll Learn |
|---|---|---|
| 1. Basic Login | Frontend auth | Sign in with Microsoft Entra ID |
| 2. Protected API | Backend auth | Build a FastAPI backend that validates tokens |
| 3. RBAC | Authorization | Control access based on user roles |
| 4. Managed Identity | Zero secrets | Deploy to Azure without storing credentials |
| 5. Multi-Tenant | Organizations | Let users from any org sign in |
| 6. Service-to-Service | OBO + Client Credentials | Authenticate services to each other |
| 7. API Gateway | Centralized auth | APIM validates once, backends trust headers |
| 8. Production Readiness | You are here | Monitoring, alerts, and security hardening |
What We're Building#
Architecture#
Blog 7 (gateway, no monitoring):
  Frontend → APIM → Task API → Notification Svc
                              → Audit Svc
  No metrics. No alerts. No health checks.
  Notification + Audit publicly reachable.

Blog 8 (production-ready):
  Frontend → APIM → Task API → Notification Svc (internal only)
                              → Audit Svc (internal only)
                   ↘
             Application Insights ← OpenTelemetry (all services)
                   ↘
             Azure Monitor Alerts → Email notifications
What Changed from Blog 7#
| Aspect | Blog 7 | Blog 8 |
|---|---|---|
| Telemetry | None | Application Insights + Log Analytics |
| Tracing | None | OpenTelemetry auto-instrumentation |
| APIM diagnostics | None | W3C trace correlation, request/response logging |
| Alerts | None | High error rate + slow response → email |
| Health probes | None | Liveness + readiness on all 4 services |
| Auto-scaling | min=0, max=1 | min=1, max=3 replicas |
| Notification ingress | External (public) | Internal only |
| Audit ingress | External (public) | Internal only |
| Python dependency | — | azure-monitor-opentelemetry |
The App#
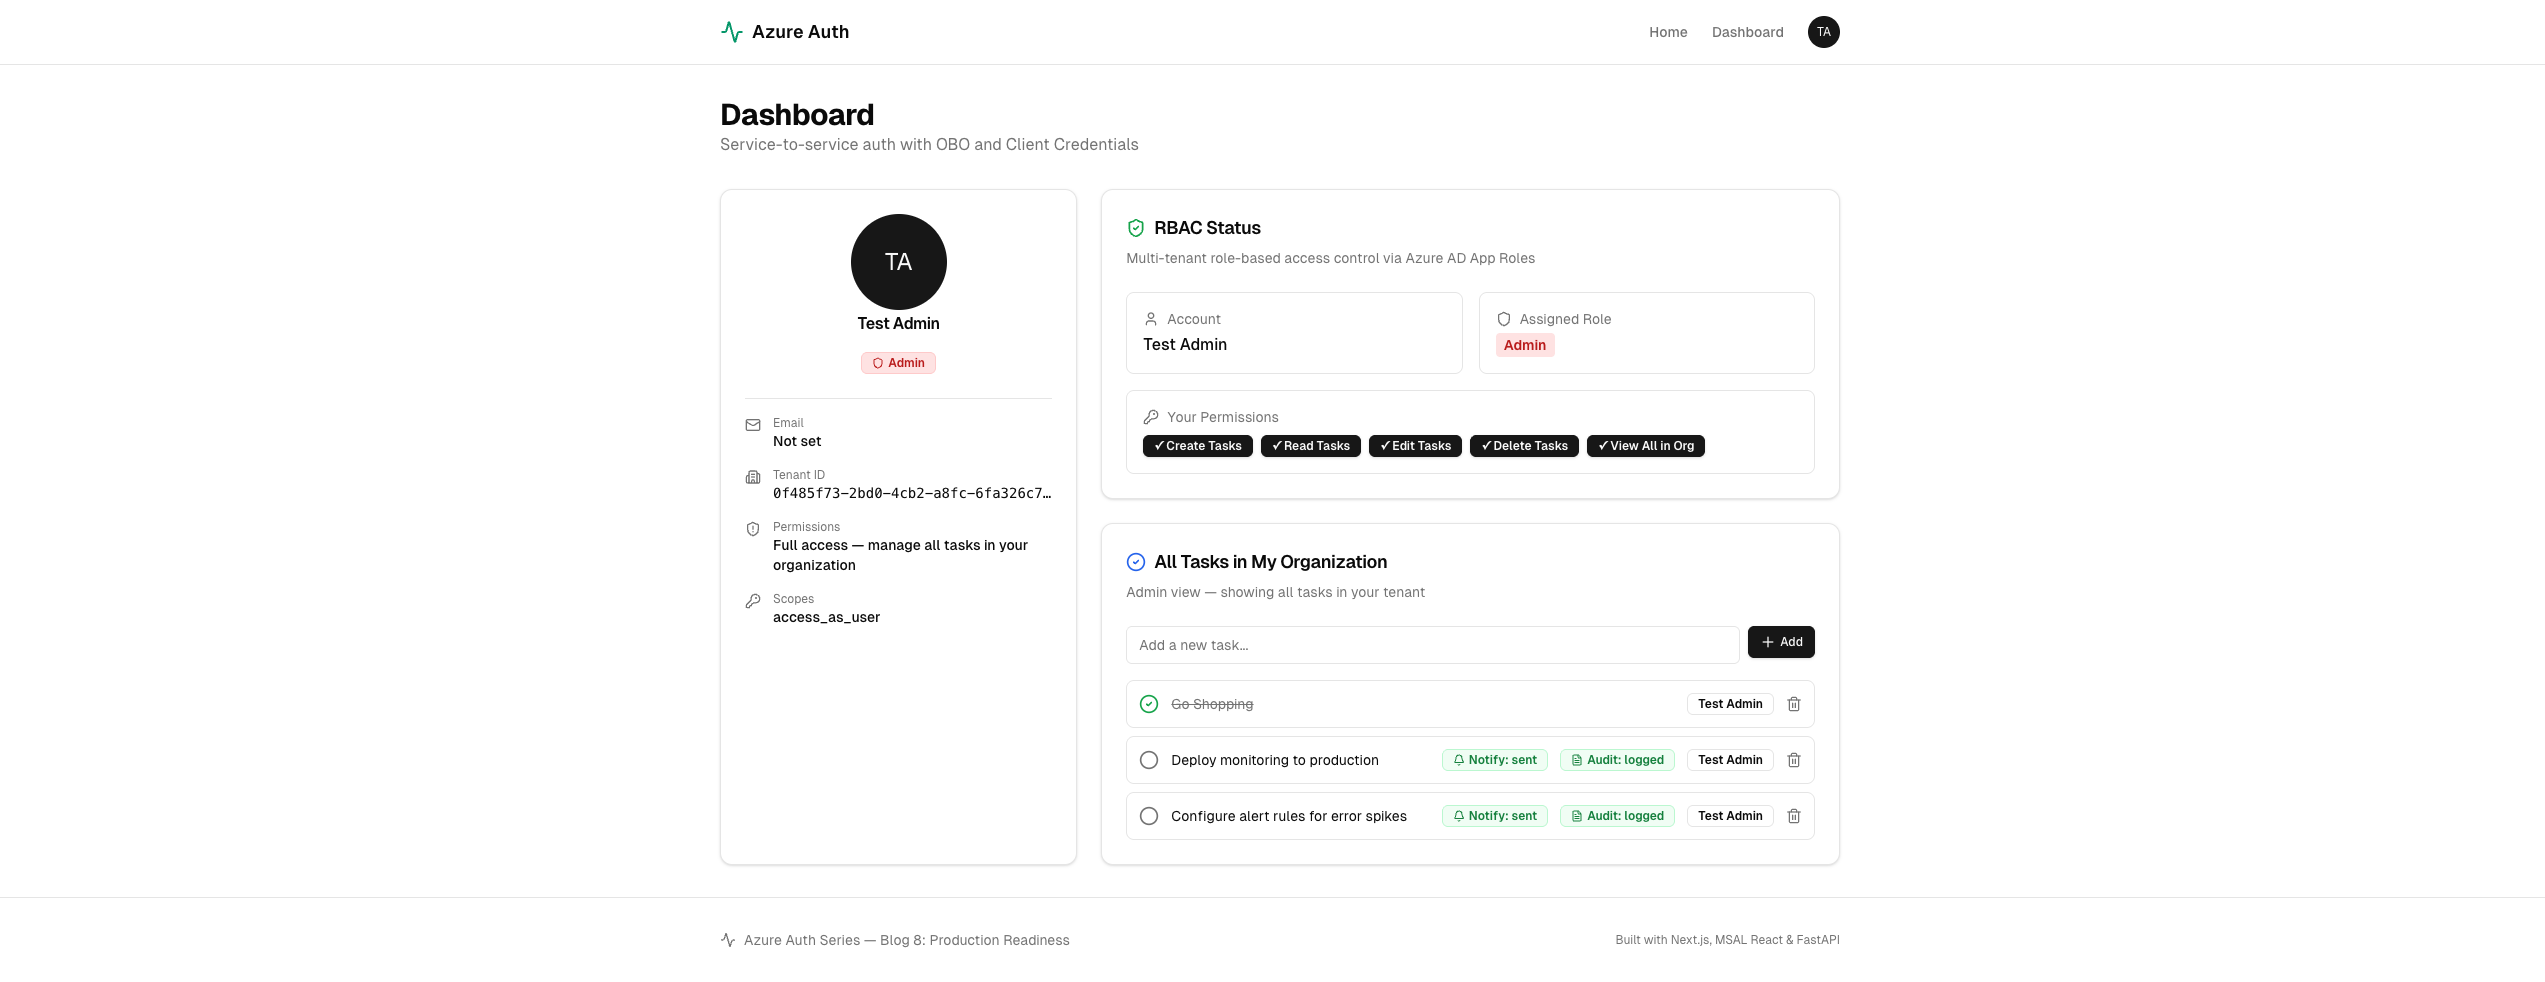
The frontend looks and works the same as Blog 7 — sign in, manage tasks, see notification and audit badges. The difference is what happens behind the scenes.
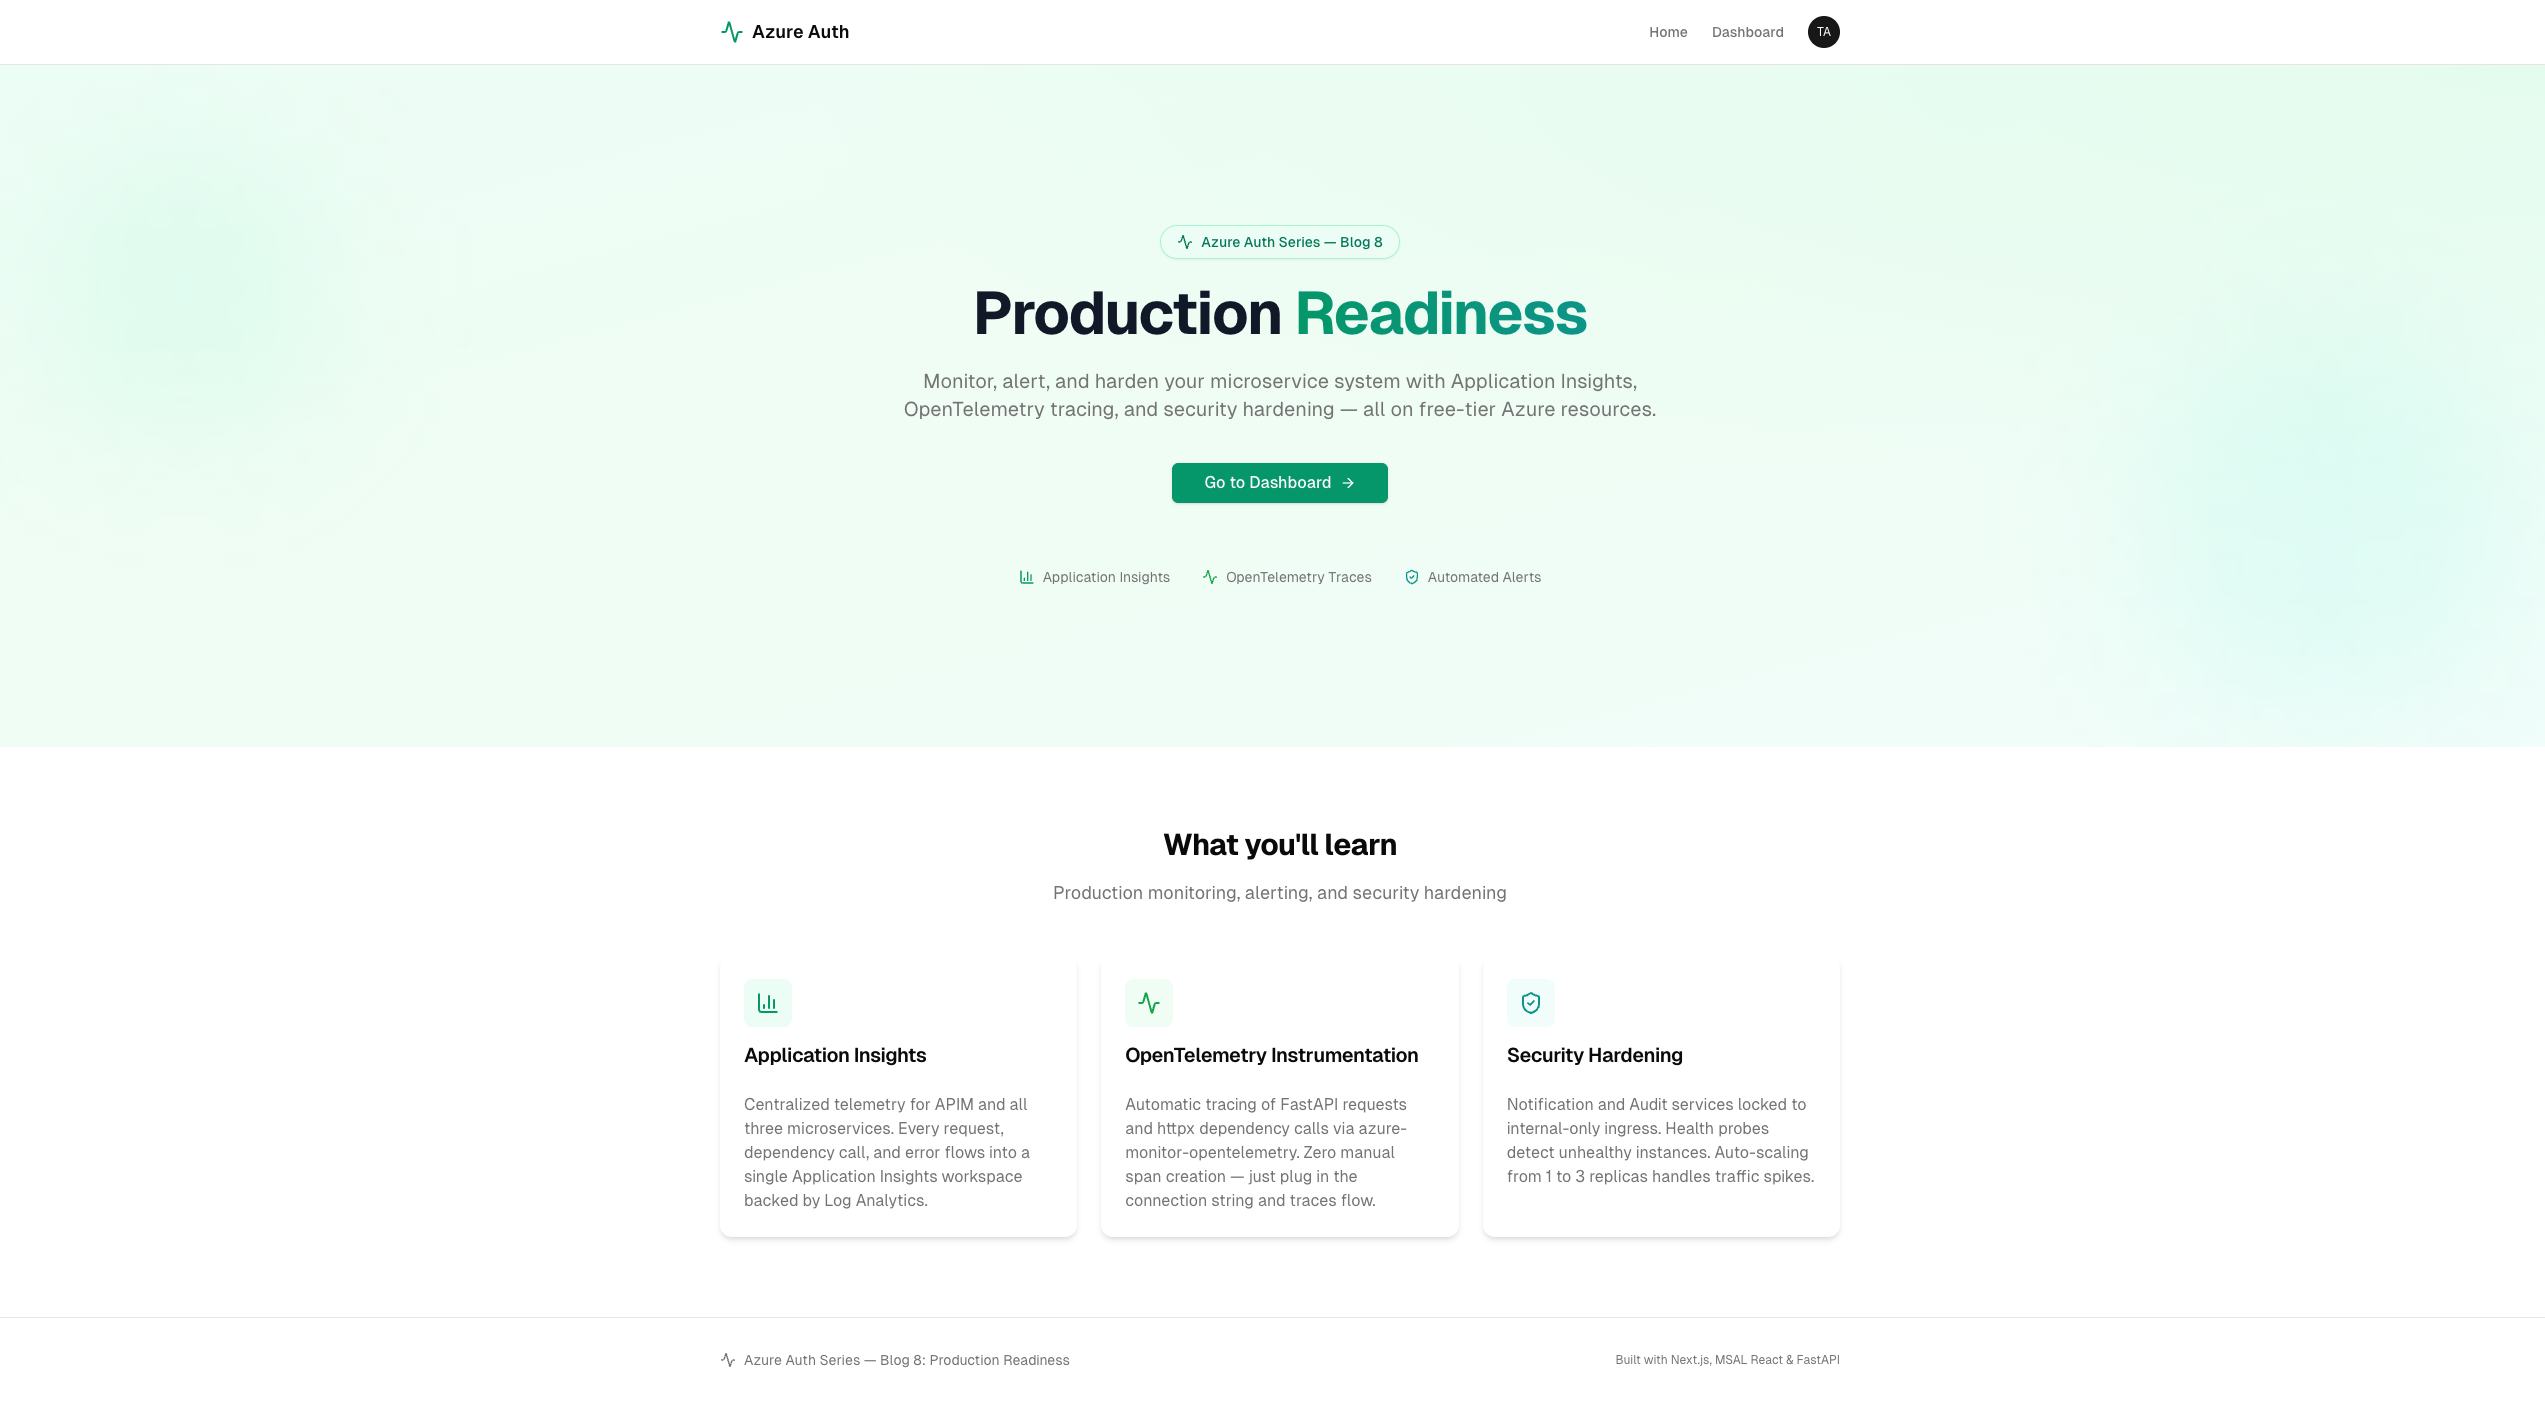
Every request now flows through Application Insights. Create a task and you'll see the full trace — APIM gateway → Task API → OBO call to Notification → Client Credentials call to Audit — all correlated with a single trace ID.
Step 1: The Monitoring Module — Terraform#
Blog 8 adds one new Terraform module: modules/monitoring/. It creates four resources.
infra/
├── main.tf
└── modules/
    ├── resource_group/
    ├── container_registry/
    ├── container_apps/        ← health probes + internal ingress
    ├── api_management/        ← APIM diagnostics
    └── monitoring/            ← NEW: App Insights + alerts
Log Analytics Workspace#
Every Azure monitoring resource needs a Log Analytics workspace as its backend store. Container Apps also uses it for platform logs.
resource "azurerm_log_analytics_workspace" "this" { name = "${var.project_name}-logs" location = var.location resource_group_name = var.resource_group_name sku = "PerGB2018" retention_in_days = 30 }
Application Insights#
Application Insights is backed by the Log Analytics workspace. All telemetry from APIM and the three backend services flows into this single resource.
resource "azurerm_application_insights" "this" { name = "${var.project_name}-appinsights" location = var.location resource_group_name = var.resource_group_name application_type = "web" workspace_id = azurerm_log_analytics_workspace.this.id }
Alert Rules#
Two metric alerts watch for problems:
# Alert: >10 failed requests in 5 minutes (Severity 2) resource "azurerm_monitor_metric_alert" "high_error_rate" { name = "${var.project_name}-high-error-rate" resource_group_name = var.resource_group_name scopes = [azurerm_application_insights.this.id] severity = 2 frequency = "PT1M" window_size = "PT5M" description = "Fires when more than 10 failed requests occur within 5 minutes" criteria { metric_namespace = "microsoft.insights/components" metric_name = "requests/failed" aggregation = "Count" operator = "GreaterThan" threshold = 10 } action { action_group_id = azurerm_monitor_action_group.email.id } } # Alert: average response time >5s over 5 minutes (Severity 3) resource "azurerm_monitor_metric_alert" "slow_response" { name = "${var.project_name}-slow-response" resource_group_name = var.resource_group_name scopes = [azurerm_application_insights.this.id] severity = 3 frequency = "PT1M" window_size = "PT5M" criteria { metric_namespace = "microsoft.insights/components" metric_name = "requests/duration" aggregation = "Average" operator = "GreaterThan" threshold = 5000 } action { action_group_id = azurerm_monitor_action_group.email.id } }
Action Group#
When an alert fires, Azure sends an email:
resource "azurerm_monitor_action_group" "email" { name = "${var.project_name}-alerts" resource_group_name = var.resource_group_name short_name = "blog08alert" email_receiver { name = "admin" email_address = var.alert_email } }
Here's what the alert email looks like when the high error rate rule fires and then resolves:
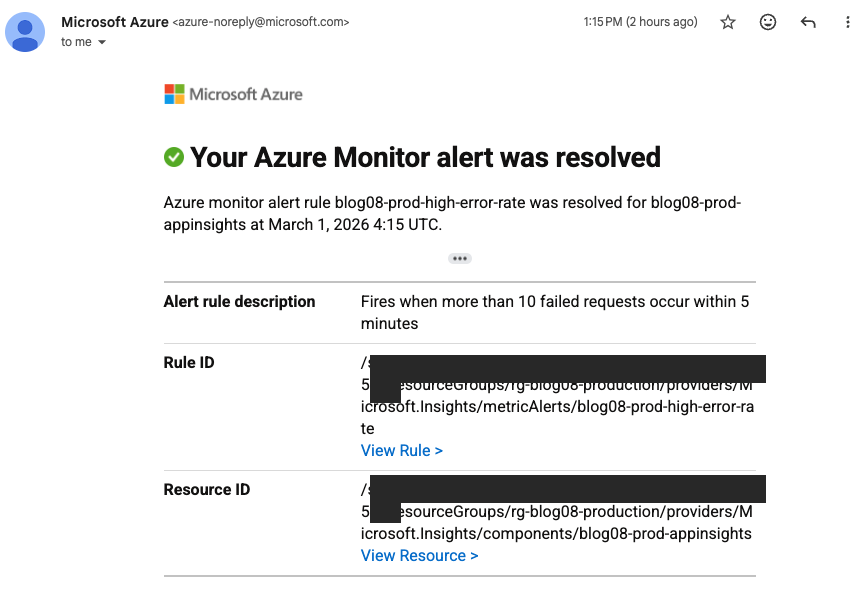
The alert description matches exactly what we defined in Terraform: "Fires when more than 10 failed requests occur within 5 minutes."
Step 2: OpenTelemetry — Three Lines of Code#
The biggest change to the Python services is surprisingly small. Each service adds one new config variable and three lines in main.py.
Config#
# config.py — NEW in Blog 8 APPINSIGHTS_CONN_STR = os.getenv( "APPLICATIONINSIGHTS_CONNECTION_STRING", "" )
Auto-Instrumentation#
# main.py — at the very top, before other imports from config import APPINSIGHTS_CONN_STR if APPINSIGHTS_CONN_STR: from azure.monitor.opentelemetry import configure_azure_monitor configure_azure_monitor(connection_string=APPINSIGHTS_CONN_STR)
That's it. azure-monitor-opentelemetry automatically instruments:
- FastAPI requests — every HTTP request is traced with duration, status code, and URL
- httpx dependency calls — every outgoing HTTP call (OBO to Notification, Client Credentials to Audit) is tracked as a dependency
- Exceptions — unhandled errors are captured with full stack traces
The if APPINSIGHTS_CONN_STR: guard means local development still works without Application Insights — just leave the env var empty.
Requirements#
One new dependency per service:
# requirements.txt — NEW in Blog 8
azure-monitor-opentelemetry==1.6.4
This pulls in OpenTelemetry, the Azure Monitor exporter, and auto-instrumentation for FastAPI, httpx, and other common libraries.
Step 3: APIM Diagnostics — Gateway-Level Telemetry#
The backend services send telemetry through OpenTelemetry, but we also want APIM itself to report to Application Insights. This gives us gateway-level metrics: request counts, latency, and error rates before traffic even reaches the backends.
# modules/api_management/main.tf resource "azurerm_api_management_logger" "appinsights" { name = "appinsights-logger" api_management_name = azurerm_api_management.this.name resource_group_name = var.resource_group_name application_insights { instrumentation_key = var.appinsights_instrumentation_key } } resource "azurerm_api_management_diagnostic" "appinsights" { identifier = "applicationinsights" api_management_name = azurerm_api_management.this.name resource_group_name = var.resource_group_name api_management_logger_id = azurerm_api_management_logger .appinsights.id sampling_percentage = 100 always_log_errors = true log_client_ip = true verbosity = "information" http_correlation_protocol = "W3C" frontend_request { body_bytes = 0 headers_to_log = ["X-User-OID", "X-Tenant-ID"] } frontend_response { body_bytes = 0 } backend_request { body_bytes = 0 } backend_response { body_bytes = 0 } }
Key settings:
| Setting | Value | Why |
|---|---|---|
sampling_percentage | 100 | Log every request (fine for dev/low traffic) |
http_correlation_protocol | W3C | Links APIM traces to backend OpenTelemetry traces |
headers_to_log | X-User-OID, X-Tenant-ID | See which user/tenant made each request |
body_bytes | 0 | Don't log request/response bodies (security) |
The W3C correlation protocol is the key: APIM generates a traceparent header, and OpenTelemetry in the backends picks it up. One trace ID follows the request from APIM → Task API → Notification Service → Audit Service.
Step 4: Security Hardening — Internal Ingress#
In Blog 7, all three backend services had external ingress — anyone on the internet could call them directly. The Notification and Audit services should only be reachable from the Task API (via OBO and Client Credentials), not from the public internet.
Blog 8 changes their ingress to internal:
# Notification Service — Blog 7 vs Blog 8 ingress { external_enabled = false # was: true target_port = 8001 transport = "http" } # Audit Service — same change ingress { external_enabled = false # was: true target_port = 8002 transport = "http" }
With external_enabled = false, these services are only reachable from other Container Apps in the same environment. The Task API can still call them (they share a Container App Environment), but nobody outside Azure can.
This matters because when TRUST_GATEWAY=true, backends trust whatever is in the X-User-* headers. If someone could reach the Notification Service directly, they could forge those headers. Internal ingress eliminates that risk.
Step 5: Health Probes and Auto-Scaling#
Health Probes#
Every service exposes a /health endpoint:
@app.get("/health") async def health(): return {"status": "healthy", "service": "task-api"}
Terraform configures two probes per Container App:
liveness_probe { transport = "HTTP" path = "/health" port = 8000 initial_delay = 10 interval_seconds = 30 failure_count_threshold = 3 } readiness_probe { transport = "HTTP" path = "/health" port = 8000 interval_seconds = 10 failure_count_threshold = 3 }
| Probe | Purpose | What happens on failure |
|---|---|---|
| Liveness | "Is the process alive?" | Container is restarted |
| Readiness | "Can it handle traffic?" | Container is removed from load balancer |
If a service crashes or hangs, Azure detects it within 30 seconds (liveness interval) and restarts the container automatically. No manual intervention needed.
Auto-Scaling#
template { min_replicas = 1 # was: 0 in Blog 7 max_replicas = 3 # was: 1 in Blog 7 }
| Setting | Blog 7 | Blog 8 | Why |
|---|---|---|---|
min_replicas | 0 | 1 | Always-on — no cold start latency |
max_replicas | 1 | 3 | Handle traffic spikes |
With min_replicas = 1, there's always a warm instance ready. With max_replicas = 3, Container Apps can scale up when load increases and scale back down when it subsides.
Step 6: Wiring It Together — Root Module#
The root main.tf wires the monitoring module into the rest of the infrastructure:
# NEW in Blog 8 module "monitoring" { source = "./modules/monitoring" project_name = var.project_name location = module.resource_group.location resource_group_name = module.resource_group.name alert_email = var.alert_email } module "container_apps" { source = "./modules/container_apps" # ... existing config ... # NEW: share Log Analytics + App Insights with Container Apps log_analytics_workspace_id = module.monitoring .log_analytics_workspace_id appinsights_connection_string = module.monitoring .connection_string } module "api_management" { source = "./modules/api_management" # ... existing config ... # NEW: connect APIM to App Insights appinsights_instrumentation_key = module.monitoring .instrumentation_key appinsights_id = module.monitoring .app_insights_id }
The monitoring module runs before Container Apps (because Container Apps needs the Log Analytics workspace ID) and before APIM (because APIM needs the instrumentation key). Terraform handles the dependency graph automatically.
The Container Apps module passes the App Insights connection string to each service as an environment variable:
env { name = "APPLICATIONINSIGHTS_CONNECTION_STRING" secret_name = "appinsights-connection-string" } secret { name = "appinsights-connection-string" value = var.appinsights_connection_string }
The connection string is stored as a Container App secret — it never appears in plaintext in the Container App configuration.
Step 7: KQL Queries — Operational Intelligence#
Application Insights stores telemetry in Log Analytics, queryable with KQL (Kusto Query Language). Blog 8 includes five ready-to-use queries in the kql/ directory.
1. Failed Auth Requests#
Detect brute-force attempts or misconfigured clients:
requests | where resultCode in ("401", "403") | summarize count() by bin(timestamp, 5m), name, resultCode | order by timestamp desc
2. Slow Requests#
Find endpoints where P95 latency exceeds 2 seconds:
requests | summarize percentile(duration, 95) by bin(timestamp, 5m), name | where percentile_duration_95 > 2000 | order by timestamp desc
3. Error Rate by Service#
Track which microservice is producing the most 5xx errors:
requests | where toint(resultCode) >= 500 | summarize errorCount=count(), totalCount=count() by bin(timestamp, 5m), cloud_RoleName | extend errorRate = round(100.0 * errorCount / totalCount, 2) | order by timestamp desc
4. Top Callers#
Identify the most active users across all endpoints:
requests | extend userOid = tostring( customDimensions["X-User-OID"] ) | where isnotempty(userOid) | summarize requestCount=count() by userOid, name | top 20 by requestCount desc
5. Dependency Failures#
Track failed service-to-service calls (OBO, Client Credentials):
dependencies | where success == false | summarize failureCount=count() by bin(timestamp, 5m), target, name, resultCode | order by timestamp desc
To run these queries: open the Azure Portal → Application Insights → Logs → paste the query → Run.
Application Insights in Action#
Here's what the Application Insights overview looks like after running the system for a while:
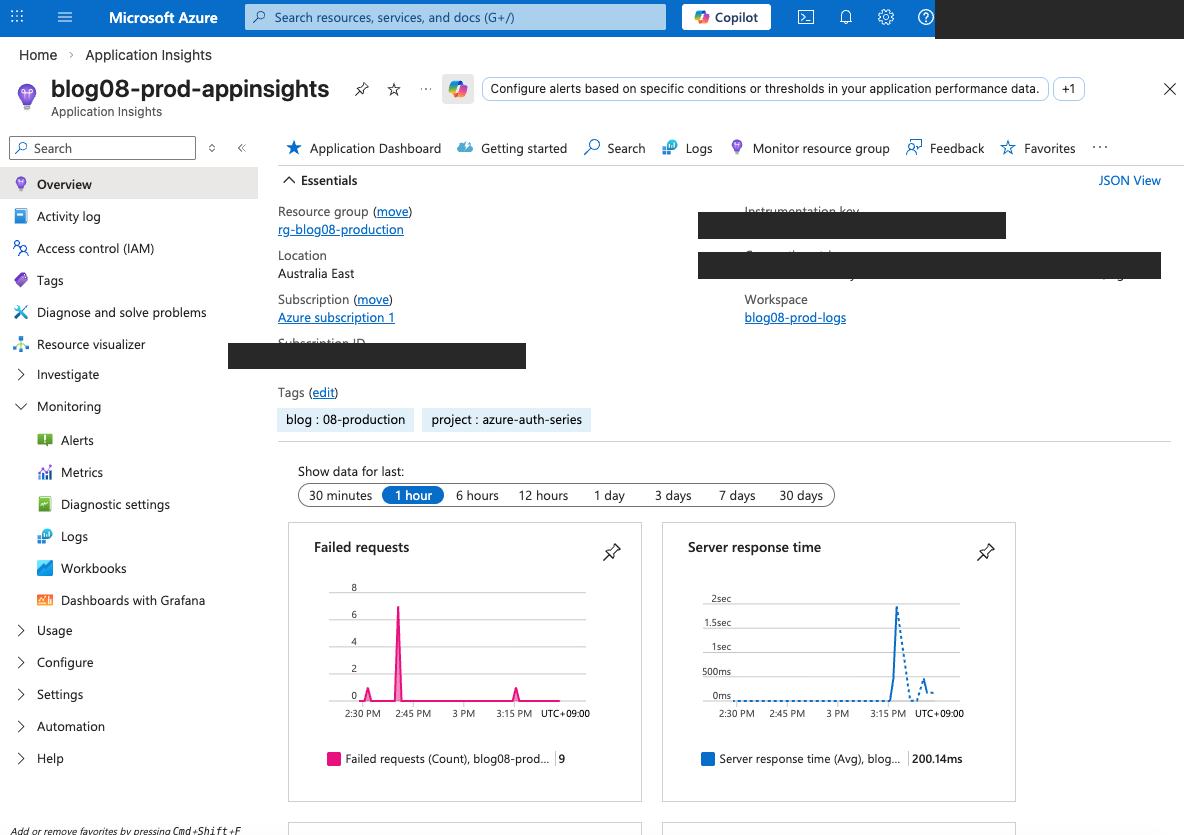
The overview shows two key charts:
- Failed requests: Spikes when something goes wrong (the alert fires if this exceeds 10 in 5 minutes)
- Server response time: Average latency across all services (200ms average in this case)
Step 8: Deployment#
The setup.sh script automates everything. It runs six phases:
./setup.sh
Phase 1: Azure AD Setup
  Create 4 app registrations (same as Blog 7)
  Create 3 test users with role assignments

Phase 2: Terraform
  terraform init && terraform apply
  Provisions: RG + ACR + 4 Container Apps + APIM
    + App Insights + Log Analytics + Alert Rules    ← NEW
  (APIM Developer tier takes ~30-45 minutes)

Phase 3: Docker Build + Push
  Build 4 images with --platform linux/amd64
  Push to ACR

Phase 4: Update Container Apps
  az containerapp update → point to real Docker images

Phase 5: Write .env Files
  task-api/.env: TRUST_GATEWAY=false (local dev)
  frontend/.env.local: API URL = APIM gateway URL

Phase 6: Verify Monitoring                          ← NEW
  Confirm App Insights resource exists
  List configured alert rules
  Show internal-only service URLs
After deployment, the setup script prints a monitoring summary:
==> Application Insights: blog08-prod-appinsights
==> Alert rules configured:
    - High error rate: >10 failed requests in 5 minutes (Severity 2)
    - Slow response: avg >5s over 5 minutes (Severity 3)
    - Alerts sent to: your-email@example.com

==> Security hardening:
    - notification-svc: internal ingress only
    - audit-svc: internal ingress only
    - All services: health probes (liveness + readiness)
    - All services: auto-scaling min=1, max=3
Cleanup#
./cleanup.sh
Destroys all Azure resources to avoid ongoing charges.
How Production Readiness Changes the System#
Without Monitoring (Blog 7)#
User creates a task
  → APIM validates JWT ✓
  → Task API creates task ✓
  → OBO → Notification Service ✓
  → Client Credentials → Audit Service ✓
  → Nobody knows if it's slow or failing ✗
With Monitoring (Blog 8)#
User creates a task
  → APIM logs request to App Insights (W3C trace ID)
  → Task API creates task (traced via OpenTelemetry)
  → OBO → Notification Service (dependency call traced)
  → Client Credentials → Audit Service (dependency call traced)
  → All telemetry correlated under one trace ID
  → If error rate spikes → alert email sent automatically
  → If service crashes → health probe restarts it
  → If traffic spikes → auto-scale to 3 replicas
Common Pitfalls#
1. OpenTelemetry Import Order#
configure_azure_monitor() must be called before importing FastAPI or any instrumented library. If you import FastAPI first, the auto-instrumentation hooks won't be installed.
# ✓ CORRECT — configure before imports from config import APPINSIGHTS_CONN_STR if APPINSIGHTS_CONN_STR: from azure.monitor.opentelemetry import configure_azure_monitor configure_azure_monitor(connection_string=APPINSIGHTS_CONN_STR) from auth import validate_token # FastAPI imported inside auth.py
# ✗ WRONG — FastAPI imported before configure from fastapi import FastAPI from config import APPINSIGHTS_CONN_STR if APPINSIGHTS_CONN_STR: configure_azure_monitor(...) # Too late!
2. Internal Ingress Doesn't Mean Private#
external_enabled = false restricts access to the Container App Environment, not to a specific app. Any Container App in the same environment can reach internal services. If you need stricter isolation, use separate environments or network security groups.
3. Alert Thresholds Need Tuning#
The default thresholds (10 failed requests, 5s response time) are reasonable starting points, but every system is different. After running in production for a week, review your actual baselines and adjust. Too sensitive = alert fatigue. Too relaxed = missed incidents.
4. Sampling in Production#
Blog 8 sets sampling_percentage = 100 on APIM diagnostics — every request is logged. For high-traffic production systems, reduce this to 10-25% to control costs and storage. Application Insights charges per GB ingested.
5. Connection String as a Secret#
The Application Insights connection string is stored as a Container App secret, not a plaintext environment variable. This prevents it from appearing in az containerapp show output or the Azure Portal configuration blade.
Cost Considerations#
| Resource | Approximate Cost |
|---|---|
| APIM Developer tier | ~$50/month |
| Application Insights | Free tier (5 GB/month ingestion) |
| Log Analytics | Free tier (5 GB/month, 31-day retention) |
| Alert rules | Free (included with Azure Monitor) |
| Action group (email) | Free |
| 4 Container Apps (0.25 CPU, 0.5 GB, min=1) | ~$0.07/hr each when active |
The monitoring additions (App Insights, Log Analytics, alerts) are all free-tier eligible. The main cost is still APIM Developer tier at ~$50/month.
Run ./cleanup.sh when you're done testing to avoid charges.
What We Built#
Blog 8 took the Blog 7 gateway setup and made it production-ready:
| Layer | What It Does |
|---|---|
| Application Insights | Centralized telemetry for all services |
| OpenTelemetry | Auto-instruments FastAPI + httpx (3 lines of code) |
| APIM Diagnostics | Gateway-level traces with W3C correlation |
| Alert Rules | Email on error spikes or slow responses |
| Health Probes | Auto-restart crashed containers |
| Auto-Scaling | 1–3 replicas per service |
| Internal Ingress | Notification + Audit locked from public internet |
| KQL Queries | 5 ready-to-use operational queries |
The entire monitoring layer was added with:
- 1 new Terraform module (monitoring)
- 3 lines of Python per service (OpenTelemetry setup)
- 1 new pip dependency (
azure-monitor-opentelemetry) - 2 Terraform changes per internal service (ingress + probes)
No application logic changed. The Task API, Notification Service, and Audit Service work exactly the same as Blog 7 — they just report what they're doing now.