Agent Observability Series — Blog 1: Architecture & OpenTelemetry Foundations#
Your AI agent is a black box. You know the input and output, but not the 47 LLM calls, 12 tool invocations, and 3 retry loops that happened in between.
I built a Deep Research Agent that decomposes questions, dispatches parallel researchers, critiques, and synthesizes cited reports. Then I built a Context Engine that cuts its token usage by 34%. Both work. But when a query takes 45 seconds instead of 12, or when the answer quality drops from 4.2 to 2.8, I have no idea why. The logs say "research_complete" and nothing else.
In this 5-part series, I'll show you how to build an Agent Observability layer — OpenTelemetry tracing with gen_ai.* semantic conventions, LLM-as-judge automated evaluation, per-request cost tracking, and anomaly detection — all visualized in a real-time React dashboard. This is the third and final series completing the trilogy: Build (Deep Research Agent) -> Optimize (Context Engine) -> Monitor (this project).
The Agent Observability Series#
| Part | Title | Focus |
|---|---|---|
| 1 | Architecture & OpenTelemetry Foundations (this post) | System design, gen_ai.* conventions, span model |
| 2 | Tracing Multi-Agent Research Pipelines | Hierarchical traces, TraceCollector, dashboard API |
| 3 | Automated Evaluation with LLM-as-Judge | 5-criteria scoring, quality trends |
| 4 | Token Cost Tracking & Budget Alerts | Per-model pricing, stage breakdown, budget alerts |
| 5 | Production Dashboard & Anomaly Detection | 4-panel dashboard, Z-score anomaly detection |
The Trilogy: Build -> Optimize -> Monitor#
This project completes a three-series arc on production AI agents:
| Series | Project | Question Answered |
|---|---|---|
| Deep Research Agent | Build | How do you build a multi-agent research pipeline? |
| Context Engine | Optimize | How do you reduce token waste by 34%? |
| Agent Observability (this series) | Monitor | How do you see what your agent is actually doing? |
Each series builds on the previous codebase. The Agent Observability project is a fork of the Context Engine, which was a fork of the Deep Research Agent. Same pipeline, same search tools, same model — but now every operation is traced, evaluated, and costed.
Why Agent Observability Is Different#
Traditional APM (Application Performance Monitoring) tracks HTTP requests, database queries, and error rates. You get latency percentiles, throughput, and 5xx rates. That works because web services are deterministic — the same endpoint does roughly the same work every time.
AI agents break every assumption:
- Non-deterministic: The same query can produce different sub-queries, different search results, different synthesis paths. Latency varies 3-10x between runs.
- Multi-step reasoning: A single user query triggers a cascade of LLM calls, tool invocations, and conditional branches. A "slow request" might be slow because of one bad search result that triggered 3 retries.
- Cost per request varies wildly: A SIMPLE query costs $0.003. A COMPLEX query with 4 parallel researchers costs $0.04. You need per-request cost visibility, not just monthly bills.
- Quality is invisible: A 200 OK tells you nothing. The agent might have returned a confident, well-cited answer — or a hallucinated mess. You need automated quality scoring.
Agent observability needs three pillars that traditional APM doesn't provide:
1. Hierarchical Tracing#
Not just "request took 12 seconds" but "decomposition took 800ms, researcher_1 took 4.2s (3 Tavily searches + 1 Bedrock call), researcher_2 took 3.8s, critique took 1.1s, synthesis took 2.1s." Every operation as a span, nested inside its parent.
2. Automated Evaluation#
After every research run, an LLM-as-judge scores the output on accuracy, completeness, citations, coherence, and relevance. One Haiku call, ~$0.001, gives you a quality signal you can track over time.
3. Cost Tracking#
Per-model pricing multiplied by actual token counts gives you per-request cost breakdowns. You can answer "which query type costs the most?" and "are we trending up or down?"
OpenTelemetry gen_ai.* Semantic Conventions#
OpenTelemetry is the industry standard for observability. In 2024, the OTEL community introduced gen_ai. semantic conventions* — a standardized set of span attributes for AI/LLM operations. Instead of every team inventing their own llm.model, ai.tokens, ml.cost attributes, gen_ai.* gives everyone the same vocabulary:
| Attribute | Example | Purpose |
|---|---|---|
gen_ai.request.model | claude-haiku-4.5 | Which model was called |
gen_ai.operation.name | chat | Type of operation |
gen_ai.usage.input_tokens | 1250 | Tokens sent to the model |
gen_ai.usage.output_tokens | 380 | Tokens generated |
gen_ai.request.temperature | 0.7 | Sampling temperature |
gen_ai.response.finish_reason | stop | Why generation stopped |
We use these conventions throughout. When you look at a span, you immediately know the model, the token counts, and the cost — regardless of which LLM provider you're using.
Architecture Overview#
The observability layer wraps the existing Context Engine pipeline. Every stage emits spans that flow to a local collector, which serves them to the React dashboard:
                          ┌──────────────────────────────────────┐
                          │          OBSERVABILITY LAYER          │
                          │                                       │
  User Query ────────────►│  trace_span("research_pipeline")      │
                          │    ├─ trace_span("decomposition")     │
                          │    ├─ trace_span("researcher_1")      │
                          │    │    ├─ trace_span("tavily_search") │
                          │    │    └─ trace_span("bedrock_call")  │
                          │    ├─ trace_span("researcher_2")      │
                          │    ├─ trace_span("critique")           │
                          │    ├─ trace_span("synthesis")          │
                          │    └─ trace_span("evaluation")         │
                          │                                       │
                          └─────────────┬─────────────────────────┘
                                        │
                                        ▼
                          ┌──────────────────────────────────────┐
                          │       LOCAL TRACE COLLECTOR            │
                          │                                       │
                          │  TraceRecord → JSON file (per trace)   │
                          │  In-memory buffer (100 most recent)    │
                          │  Aggregated stats (p50, p95, avg)      │
                          │                                       │
                          └─────────────┬─────────────────────────┘
                                        │
                                        ▼
                          ┌──────────────────────────────────────┐
                          │         REACT DASHBOARD               │
                          │                                       │
                          │  ┌──────────┐  ┌──────────────────┐   │
                          │  │  Trace   │  │  Quality Chart   │   │
                          │  │ Waterfall│  │  (LLM-as-judge)  │   │
                          │  └──────────┘  └──────────────────┘   │
                          │  ┌──────────┐  ┌──────────────────┐   │
                          │  │   Cost   │  │   Alert Panel    │   │
                          │  │Breakdown │  │  (anomalies)     │   │
                          │  └──────────┘  └──────────────────┘   │
                          │                                       │
                          └───────────────────────────────────────┘
No external infrastructure. No Jaeger. No Datadog. The collector stores traces as JSON files on disk, keeps the 100 most recent in memory, and serves them via REST API to the dashboard. For a local development tool, this is exactly the right trade-off — zero setup, zero cost, instant visibility.
The SpanData Class#
The foundation of the tracing system is SpanData — a lightweight dataclass that represents a single operation in the trace:
@dataclass class SpanData: """Lightweight span representation (no OTEL dependency for local dev).""" span_id: str = "" parent_id: str = "" trace_id: str = "" name: str = "" start_time: float = 0.0 end_time: float = 0.0 duration_ms: float = 0.0 status: str = "ok" attributes: dict = field(default_factory=dict) events: list[dict] = field(default_factory=list) def to_dict(self) -> dict: return asdict(self)
A few design decisions worth noting:
- No full OTEL SDK dependency. The full OpenTelemetry Python SDK is heavy — it pulls in grpc, protobuf, and a dozen transitive dependencies. For local development, we don't need OTLP exporters or remote collectors. We follow the gen_ai.* conventions (attribute names) without the SDK overhead.
parent_idfor hierarchy. Every span knows its parent, which lets the dashboard render a nested waterfall view. Whenresearcher_1makes atavily_searchcall, the search span'sparent_idpoints to the researcher span.attributesis a free-form dict. This is where gen_ai.* attributes go:gen_ai.request.model,gen_ai.usage.input_tokens, etc. No rigid schema — you add what you need per span type.eventsfor exceptions. When a span errors, it captures the exception message as an event, following OTEL's event model.
The trace_span() Context Manager#
The core instrumentation primitive is trace_span() — a context manager that automatically tracks timing, parent-child relationships, and error status:
# Global trace context _current_trace_id: str = "" _current_spans: list[SpanData] = [] _span_stack: list[str] = [] # Stack of parent span IDs @contextmanager def trace_span(name: str, attributes: dict | None = None): """Create a span that tracks timing and attributes. Uses gen_ai.* semantic conventions for AI-specific attributes. Example: with trace_span("bedrock_call", { "gen_ai.request.model": "claude-haiku-4.5", "gen_ai.operation.name": "chat", }) as span: result = await model.invoke(prompt) span.attributes["gen_ai.usage.input_tokens"] = result.input_tokens span.attributes["gen_ai.usage.output_tokens"] = result.output_tokens """ global _current_trace_id if not _current_trace_id: _current_trace_id = str(uuid4())[:16] span = SpanData( span_id=str(uuid4())[:12], parent_id=_span_stack[-1] if _span_stack else "", trace_id=_current_trace_id, name=name, start_time=time.time(), attributes=attributes or {}, ) _span_stack.append(span.span_id) try: yield span except Exception as e: span.status = "error" span.events.append({"name": "exception", "message": str(e)}) raise finally: span.end_time = time.time() span.duration_ms = round((span.end_time - span.start_time) * 1000, 2) _span_stack.pop() _current_spans.append(span)
The _span_stack is the key insight. It's a simple list that acts as a stack — when you enter a span, its ID gets pushed onto the stack. Any nested span created inside it automatically gets the top of the stack as its parent_id. When the span exits, it pops itself off. This gives you hierarchical traces without any explicit parent passing:
with trace_span("research_pipeline"): # parent_id = "" with trace_span("researcher_1"): # parent_id = research_pipeline with trace_span("tavily_search"): # parent_id = researcher_1 ... with trace_span("bedrock_call"): # parent_id = researcher_1 ... with trace_span("critique"): # parent_id = research_pipeline ...
Instrumenting the Research Pipeline#
Here's how app.py wraps the research pipeline with trace spans. The key section is in the WebSocket handler:
if should_research: trace_id = new_trace() research_start = time.time() context_engine = ContextEngine() with trace_span("research_pipeline", { "gen_ai.request.model": settings.bedrock_model_id, "query": message[:100], "complexity": complexity.level.value, }): async for event in run_research(message, conv_id, context_engine=context_engine): if event.get("type") == "text": assistant_response += event.get("data", "") elif event.get("type") == "sources": assistant_sources = event.get("sources", []) await send_event(event) # Post-research observability research_duration = (time.time() - research_start) * 1000 spans = get_current_spans() # Evaluate quality with LLM-as-judge eval_result = await evaluate_research(message, assistant_response, assistant_sources) evaluation = eval_result.to_dict() # Track cost cost_tracker = get_cost_tracker() cost_tracker.start_request() for stage in context_engine.stages: if stage.tokens > 0: input_t = int(stage.tokens * 0.75) output_t = stage.tokens - input_t cost_tracker.record_call(stage.name, settings.bedrock_model_id, input_t, output_t) request_cost = cost_tracker.finish_request(query=message) # Store trace collector = get_collector() collector.store_trace(TraceRecord( trace_id=trace_id, query=message, start_time=datetime.fromtimestamp(research_start, tz=timezone.utc).isoformat(), end_time=datetime.now(timezone.utc).isoformat(), duration_ms=round(research_duration, 1), total_tokens=engineered_tokens, total_cost=request_cost.get("total_cost", 0), spans=[s.to_dict() for s in spans], evaluation=evaluation, complexity=complexity.level.value, ))
Every research request now flows through this pipeline: trace the execution, evaluate the output, cost the tokens, store the record, and check for anomalies. Five operations that add ~200ms to a 12-second research pipeline — a 1.6% overhead for complete visibility.
Live Demo#
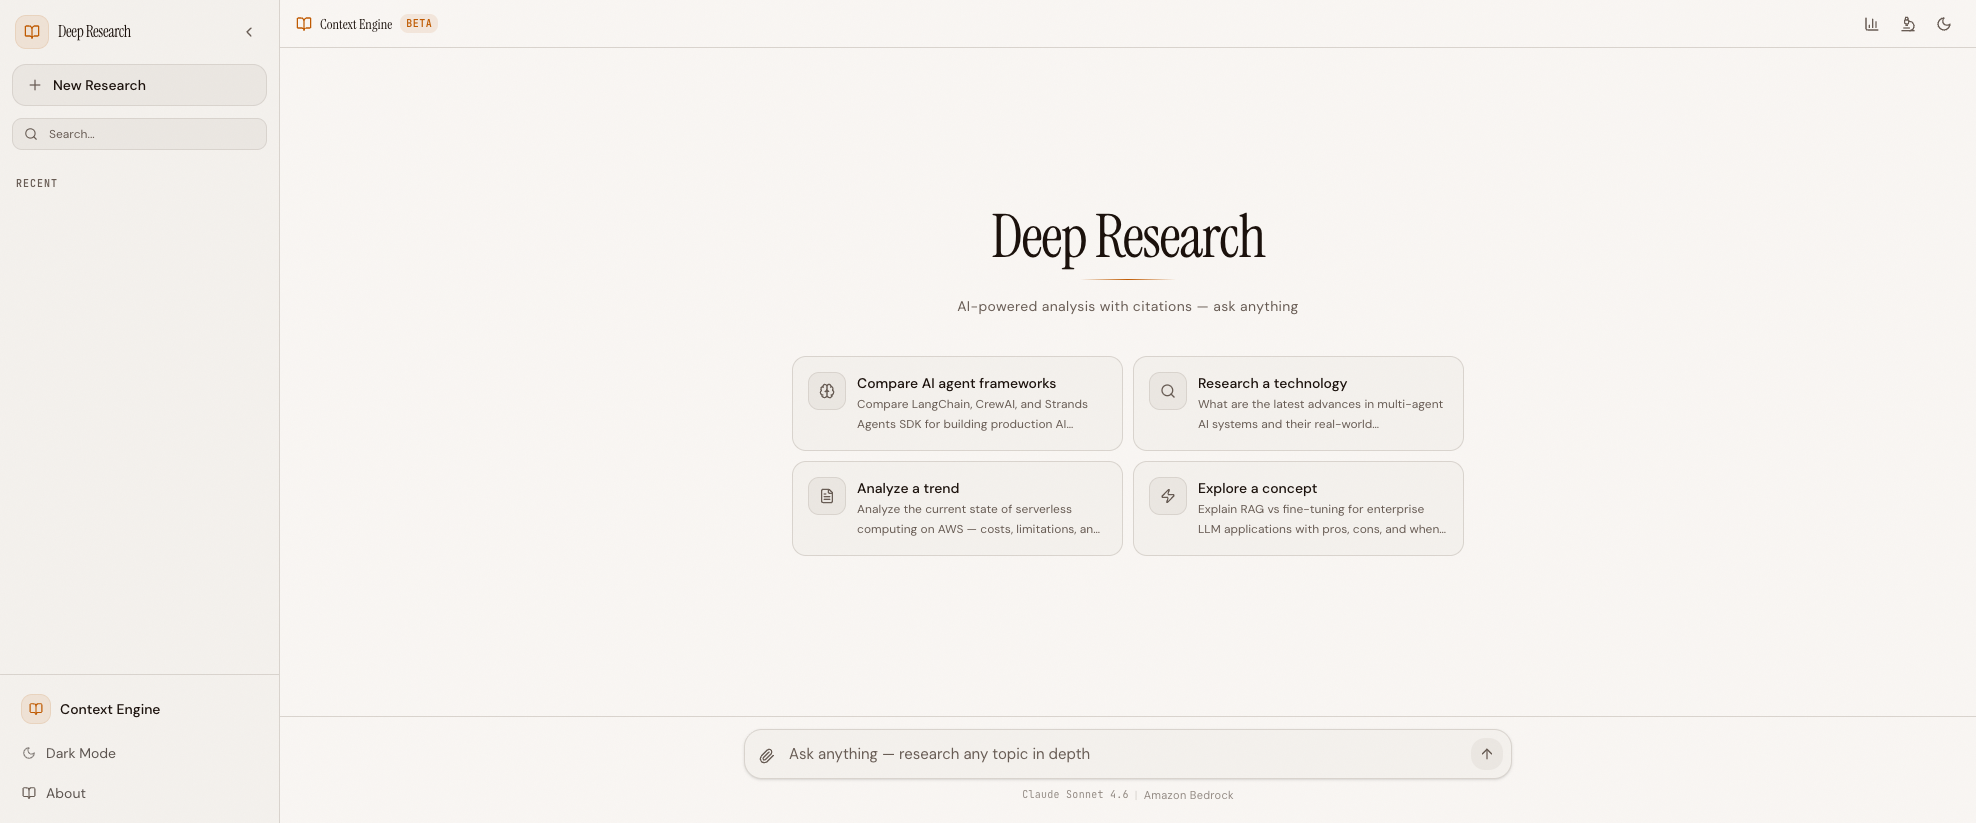 The Agent Observability interface — same research pipeline, new dashboard tab for traces, quality scores, cost breakdowns, and anomaly alerts
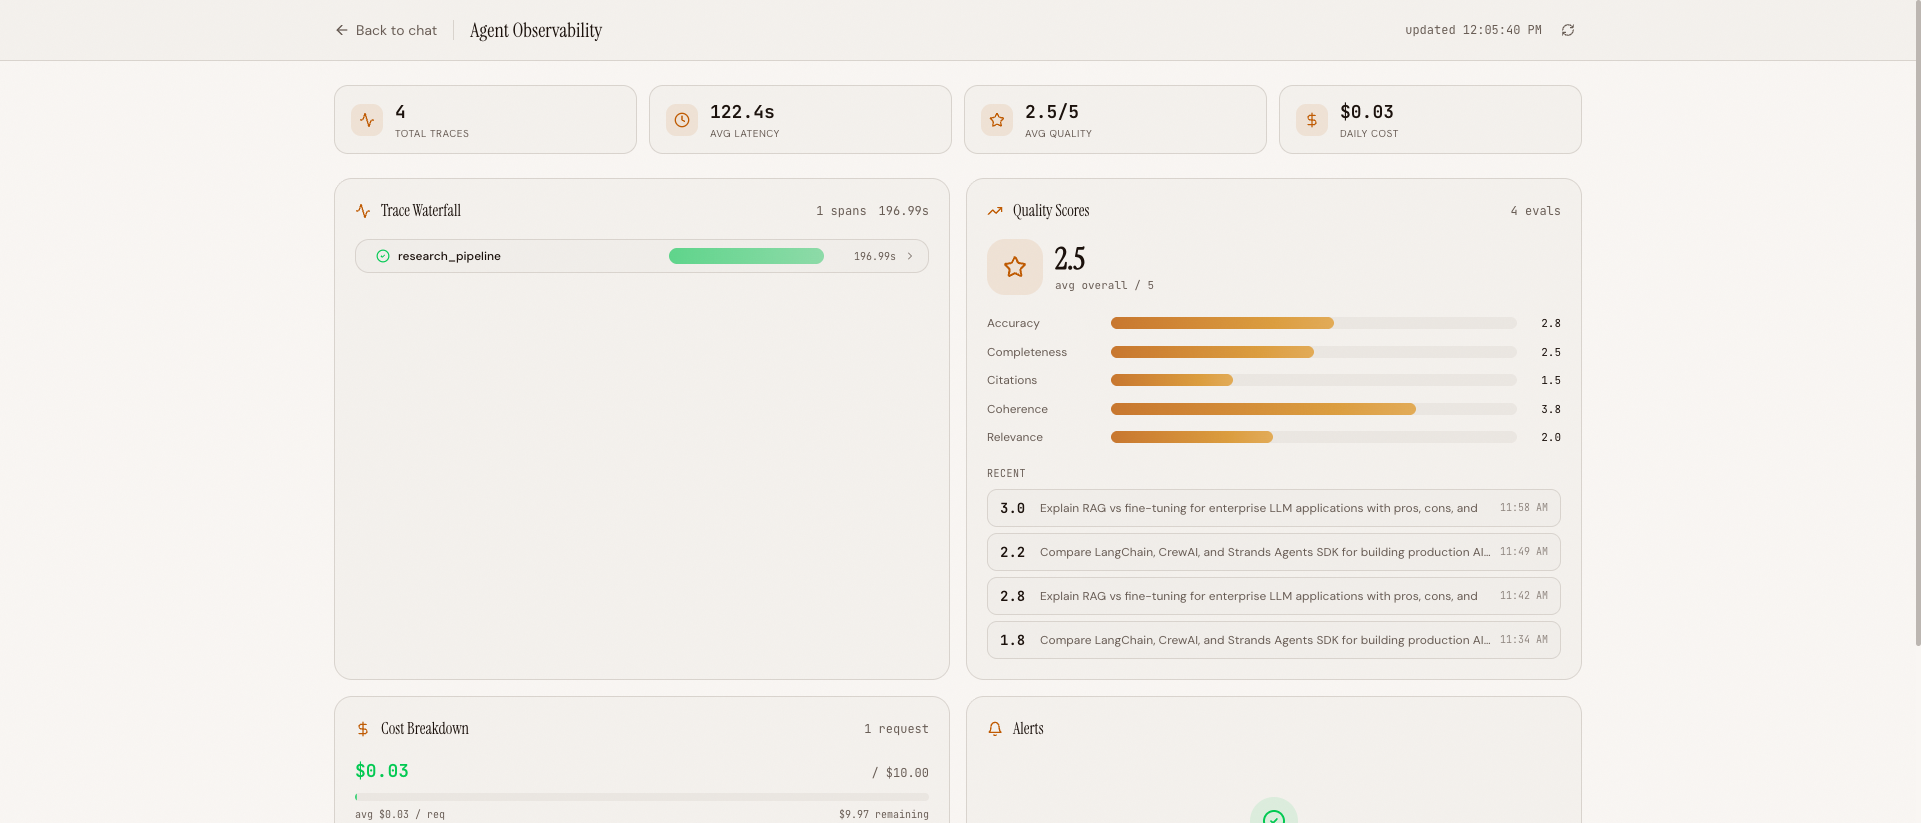 The observability dashboard: trace waterfall (top-left), quality chart (top-right), cost breakdown (bottom-left), and alert panel (bottom-right)
Tech Stack#
| Layer | Technology | Why |
|---|---|---|
| AI Model | Claude Haiku 4.5 via Amazon Bedrock | Fast, cost-effective for parallel agents + judge |
| Agent SDK | Strands Agents SDK | Clean @tool decorators, async support, Bedrock native |
| Backend | Python 3.12 + FastAPI | Async-first, WebSocket support |
| Frontend | React 19 + TypeScript + Vite | Modern, fast HMR |
| Tracing | OpenTelemetry gen_ai.* conventions | Industry standard span attributes |
| Evaluation | LLM-as-judge (Haiku) | Automated quality scoring, 5 criteria |
| Cost Tracking | Per-model pricing tables | Per-request cost breakdowns |
| Anomaly Detection | Z-score on latency/cost/quality | Flag 3-sigma outliers |
| Search | Tavily API | Purpose-built for AI search |
| Storage | Local JSON files | No external DB, zero setup |
| Dev Environment | Docker Compose | Backend + frontend with hot reload |
The key addition versus the Context Engine is the observability/ package — 6 Python modules that implement tracing, evaluation, cost tracking, anomaly detection, a trace collector, and a dashboard API. No new infrastructure. No Jaeger. No Prometheus. Just Python code and JSON files.
Project Structure#
agent_observability/
├── backend/
│   ├── observability/              # NEW — Observability layer
│   │   ├── tracer.py               # OTEL setup + span helpers
│   │   ├── instrumentor.py         # Auto-instrument Bedrock/Tavily
│   │   ├── evaluator.py            # LLM-as-judge evaluation
│   │   ├── cost_tracker.py         # Token cost calculation
│   │   ├── anomaly_detector.py     # Z-score anomaly detection
│   │   ├── collector.py            # Local trace/metric storage
│   │   └── dashboard_api.py        # REST API for dashboard
│   ├── context/                    # Context engine (inherited)
│   ├── agents/                     # Orchestrator (instrumented)
│   ├── tools/                      # Tools (instrumented)
│   └── app.py                      # FastAPI + WebSocket + dashboard
├── frontend/
│   ├── src/
│   │   ├── components/
│   │   │   ├── dashboard/          # NEW — Dashboard components
│   │   │   │   ├── TraceWaterfall.tsx
│   │   │   │   ├── QualityChart.tsx
│   │   │   │   ├── CostBreakdown.tsx
│   │   │   │   ├── AlertPanel.tsx
│   │   │   │   └── DashboardPage.tsx
│   │   │   └── ...                 # Existing components
│   │   └── ...
├── data/
│   ├── memory.json                 # Context engine memory
│   ├── traces/                     # Trace storage (JSON per trace)
│   └── evaluations/                # Evaluation scores
└── docker-compose.yml
The observability layer sits alongside the context engine — both wrap the same research pipeline, but at different levels. The context engine optimizes what goes into the LLM. The observability layer measures what comes out.
Running It Yourself#
Prerequisites#
- Python 3.12+ and Node.js 22+
- Docker (for local dev)
- AWS CLI with a named profile that has Bedrock access
- Tavily API key — Free at tavily.com
Quick Start#
git clone https://github.com/MinhQuanBuiSco/agent-observability.git cd agent-observability # Create .env with your Tavily key echo "TAVILY_API_KEY=tvly-your-key" > .env # Start both services docker compose up --build # Open http://localhost:5173 # Dashboard at http://localhost:5173/dashboard
AWS Profile: The
docker-compose.ymlusesAWS_PROFILE=devby default. Replacedevwith your own profile name, or set the environment variable before running:AWS_PROFILE=your-profile-name docker compose up --build
What's Next#
In Blog 2: Tracing Multi-Agent Research Pipelines, we'll dive into the TraceCollector — how traces are stored as JSON files, loaded from disk on startup, and served via REST API. We'll walk through the hierarchical trace structure (session -> research -> sub-query -> LLM call -> tool use), the aggregated stats computation (p50, p95, avg duration), and the seeding pattern that gives the anomaly detector a baseline from historical traces.
This project is a fork of the Context Engine, which is a fork of the Deep Research Agent — read those series first for the base pipeline.
All code is open source: github.com/MinhQuanBuiSco/agent-observability